


Overview
In the first post in this series, we looked at how we can use the aws-embedded-metrics npm package to easily generate custom metrics from our Lambda functions. In this post, we will look at how we use these custom metrics to add alerting to our applications. We will do this through Infrastructure as Code (IaC) using the AWS Cloud Development Kit (CDK), so that we ensure the appropriate alarms are in place whenever our application is deployed.
The code for this post is ready to be cloned, deployed, and run from the accompanying GitHub repo.
TL;DR
- Use the
Metricclass to reference metrics in CDK code - Use
Metricinstances to create alarms - Use
setDimensionsto only log the dimensions you specify
The application
Our application is a step function that consists of two Lambda functions that make calls to external APIs, followed by a Lambda function that persists the results. If calls to either of the external APIs fails, then the error is caught and handled by a Lambda function that records a custom metrics indicating that an error occurred.
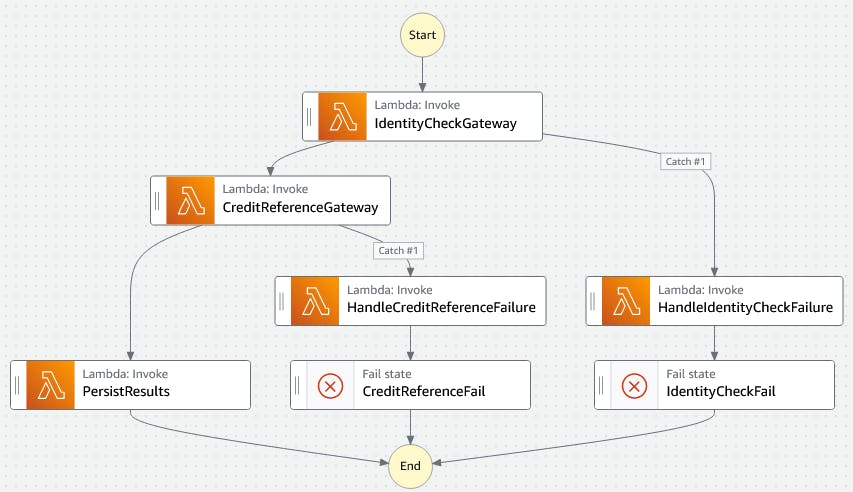
Our challenge is to use CDK to add a CloudWatch alarm to notify us when an error has occurred.
Outputting the metric
The first step is to get our code to output the custom metric that will trigger the alarm.
We do this via the error handling Lambda function, which consists of just the following code:
export const handler = metricScope(
  (metrics) =>
    async (event: any): Promise<void> => {
      metrics
        .setNamespace('EmbeddedMetricsExample')
        .putDimensions({ ProcessName: 'LoanProcessor' })
        .putMetric('ErrorCount', 1, Unit.Count)
    }
);
Here use the setNamespace method to explicitly set a namespace for our application, otherwise our metrics will be grouped under the default value of aws-embedded-metrics. We then specify the dimension ProcessName for our metric with the value LoanProcessor. We do this, as we want to be able to set an alarm for this specific process. Finally, we specify the actual metric, which in our case is an error count of 1. In our alarm, we will sum up these counts to detect when something has gone wrong.
For further information on using dimensions, you can read the AWS documentation.
Testing the metric
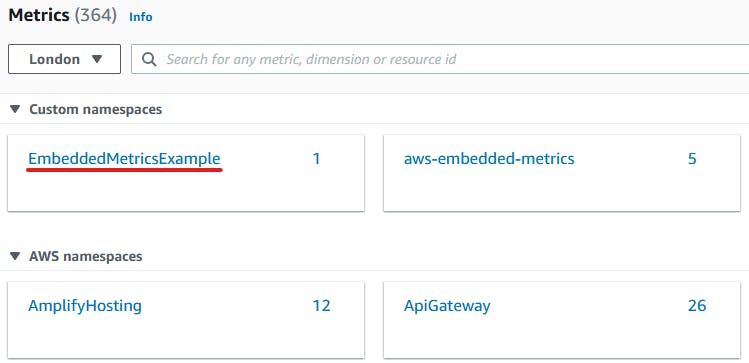
To test the metric, we configure the Identity Check API to always error and run a unit test to call our step function. The result is that we can now see our namespace within the AWS Console:
Clicking on the namespace we can now see our ErrorCount metric:
Setting up the alarm
In our application, we have encapsulated the step function and related Lambda functions in a CDK construct called LoanProcessor. We want to extend this construct so that it can publish to an SNS topic when an error occurs. The first step to do this is to extend the construct props with the SNS topic. Doing it this way decouples the LoanProcessor construct from how error notifications are handled.
export interface LoanProcessorProps {
  // <snip>
  alarmTopic: sns.ITopic;
}

export default class LoanProcessor extends cdk.Construct {

  constructor(scope: cdk.Construct, id: string, props: LoanProcessorProps) {
    // <snip>
The next step is to reference our custom metric. This is done via the CDK Metric class. The documentation points out the following:
This class does not represent a resource, so hence is not a construct. Instead, Metric is an abstraction that makes it easy to specify metrics for use in both alarms and graphs.
So we need to be aware that the following code is not creating the metric. The metric is only created when the first one is logged.
const loanProcessorErrorCount = new cw.Metric({
  namespace: 'EmbeddedMetricsExample',
  metricName: 'ErrorCount',
  dimensionsMap: {
    ProcessName: 'LoanProcessor',
  },
})
With a reference to the metric, we can now create an alarm. In our case, we want to trigger it when we get at least one error. Since we don't publish any metrics when we succeed, we set treatMissingData such that it will not trigger the alarm.
const loanProcessorErrorCountAlarm = loanProcessorErrorCount.createAlarm(
  this,
  'LoanProcessorErrorCountAlarm',
  {
    evaluationPeriods: 1,
    comparisonOperator: cw.ComparisonOperator.GREATER_THAN_THRESHOLD,
    threshold: 0,
    treatMissingData: cw.TreatMissingData.NOT_BREACHING,
  }
);
Now, I was expecting that we would need to specify the period length and the aggregation function as part of the alarm. However, it turns out that we need to specify these using the with method on the metric.
const loanProcessorErrorCount = new cw.Metric({
  // <snip>
}).with({
  statistic: 'sum',
  period: cdk.Duration.minutes(5),
});
The AWS documentation Using Amazon CloudWatch alarms provides a comprehensive guide to setting up alarms, covering the in detail how alarms are evaluated. If you are setting up alarms, I would recommend that you read and understand it.
We now have an alarm that should trigger when any 5 minute period contains at least one error. The final step is to add an action to our alarm, which in our case is to publish to the SNS topic specified via the construct props.
loanProcessorErrorCountAlarm.addAlarmAction(new cwActions.SnsAction(props.alarmTopic));
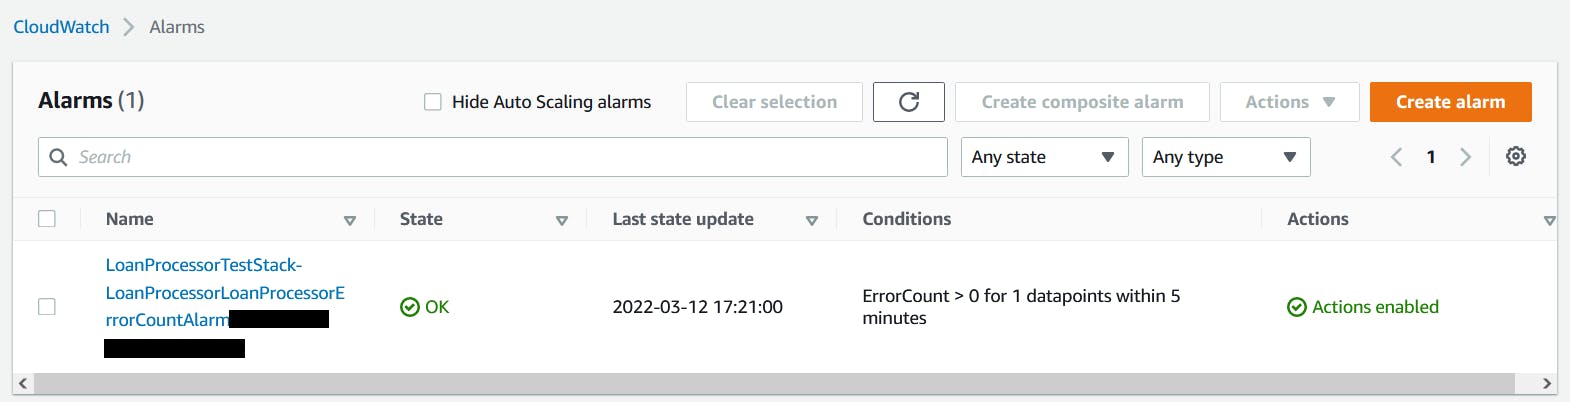
After deploying to AWS, we can now see our alarm in the AWS Console:
Testing the alarm
As before, with the Identity Check API configured to always error, we run the unit test to start the step function. Then we wait to see if our alarm triggers.
And we wait, and we wait.
Our alarm is not triggering and the reason turns out to be that we have not matched the dimensions of the metric.
Overriding the default dimensions
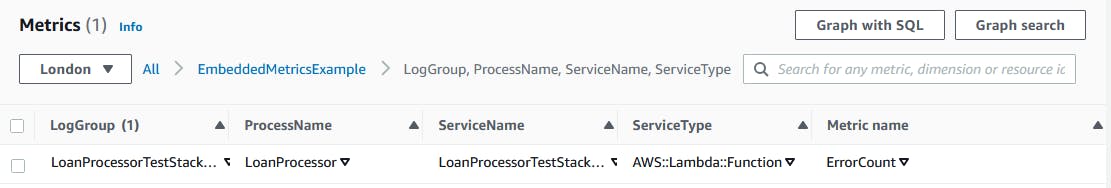
If we look again at the metric in the AWS Console, we notice the following:
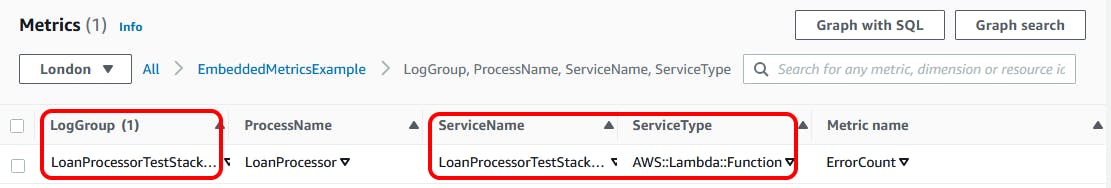
We can see that, along with our dimension (ProcessName), the metric is being logged with the following three dimensions:
LogGroupServiceNameServiceType
So, to get our alarm to trigger, we either need to add these dimensions to it or find a way to override the default dimensions. The latter is straightforward to do, we just need to use the setDimensions method when logging the metric rather than the putDimensions method.
Our metric logging code becomes the following:
export const handler = metricScope(
  (metrics) =>
    async (event: any): Promise<void> => {
      metrics
        .setNamespace('EmbeddedMetricsExample')
        .setDimensions({ ProcessName: 'LoanProcessor' }) // <== Overrides defaults
        .putMetric('ErrorCount', 1, Unit.Count)
    }
);
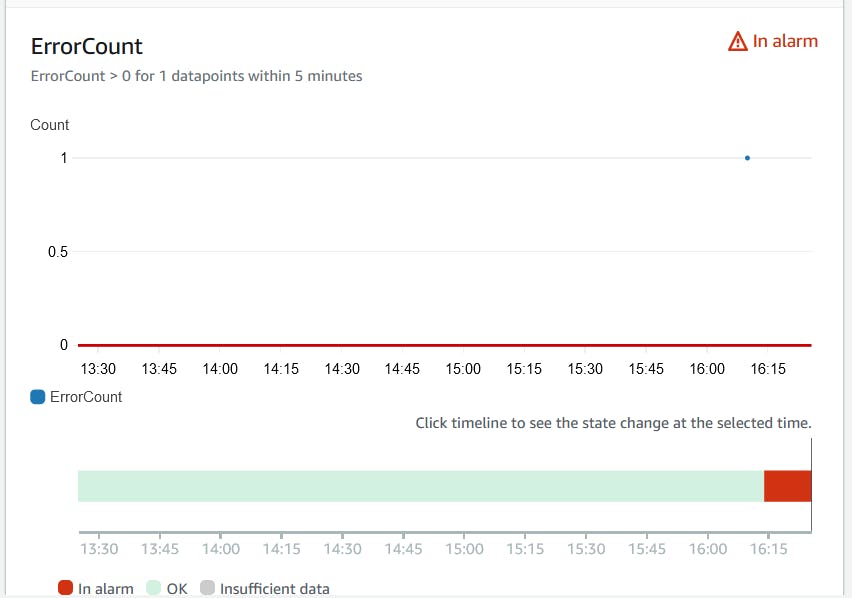
Now when we call the step function, we can see in the AWS Console that the alarm has triggered:
Looking at the logged event from the SNS error topic, we can see the following details are being sent:
{
   "AlarmName": "LoanProcessorTestStack-LoanProcessorLoanProcessorErrorCountAlarmXXXXXX-XXXXXXXX",
   "AlarmConfigurationUpdatedTimestamp": "2022-03-13T09:06:59.103+0000",
   "NewStateValue": "ALARM",
   "NewStateReason": "Threshold Crossed: 1 datapoint [1.0 (13/03/22 16:09:00)] was greater than the threshold (0.0).",
   "StateChangeTime": "2022-03-13T16:14:03.383+0000",
   "OldStateValue": "OK",
   "OKActions": [],
   "AlarmActions": [
      "arn:aws:sns:eu-west-2:99999999:LoanProcessorTestStack-LoanProcessorAlarmTopicXXXXX-XXXXXXX"
   ],
   "InsufficientDataActions": [],
   "Trigger": {
      "MetricName": "ErrorCount",
      "Namespace": "EmbeddedMetricsExample",
      "StatisticType": "Statistic",
      "Statistic": "SUM",
      "Unit": null,
      "Dimensions": [
         {
            "value": "LoanProcessor",
            "name": "ProcessName"
         }
      ],
      "Period": 300,
      "EvaluationPeriods": 1,
      "ComparisonOperator": "GreaterThanThreshold",
      "Threshold": 0,
      "TreatMissingData": "notBreaching",
      "EvaluateLowSampleCountPercentile": ""
   }
}
Summary
In this post, we saw how we can use the CDK to set up alarms based on our custom metrics. We saw how to specify the details of the alarm, such as the statistic to use and how to treat missing data. We also saw how we can override the default dimensions so that our alarm triggers as expected.